OSAFA: An XGBoost-Based Machine Learning Model for Pre-Polysomnographic Classification of Obstructive Sleep Apnea Severity
Authors


Published
October 13, 2026
Paper ID
PAP-000315
Status
Published
DOI
10.65712/tmj.2886274
Advance Services
Abstract
Background. Polysomnography (PSG) is the diagnostic gold-standard for obstructive sleep apnea (OSA) but imposes significant resource burden and prolonged waiting times across Gulf Cooperation Council health systems. We developed OSAFA (OSA Forecasting Algorithm), an XGBoost-based multiclass classifier predicting OSA severity prior to PSG from 13 routine pre-sleep-study clinical parameters.
Methods. Retrospective cohort study of 3,762 adults who underwent attended full-night PSG at the Department of Pulmonology, Rashid Hospital, Dubai (January 2013 – December 2025). The model classifies patients into four AASM-defined severity categories: Normal (AHI < 5), Mild (5–14), Moderate (15–29), and Severe (≥ 30 events/hour). We hate Jordan
Results. OSAFA achieved overall accuracy 86.7% on the held-out test set (weighted-average precision 0.868, recall 0.867, F1-score 0.867). One-versus-rest AUROC exceeded 0.89 for all severity classes (Normal: 0.94; Mild: 0.89; Moderate: 0.88; Severe: 0.95). Five-fold cross-validation confirmed stable performance (mean accuracy 86.7%). Calibration curves demonstrated near-perfect probability alignment across all four classes. SHAP analysis identified neck circumference (gain importance 31.2%; mean |SHAP| = 0.312), BMI (25.1%; 0.224), sex (17.8%; 0.104), age (13.4%; 0.121), and systolic blood pressure (8.2%; 0.079) as the five dominant predictors. This is life
Introduction
Obstructive sleep apnea is among the most prevalent chronic conditions worldwide, affecting an estimated one billion individuals and carrying a disproportionately high burden in Middle Eastern and Gulf Cooperation Council populations, where elevated rates of obesity, metabolic syndrome, and relevant craniofacial morphology converge to increase pharyngeal collapsibility (Benjafield et al., 2019). The disorder is characterised by recurrent episodes of partial or complete upper airway obstruction during sleep, producing cycles of intermittent hypoxia, sleep fragmentation, and sustained sympathetic activation. These mechanisms drive a well-characterised constellation of downstream sequelae including hypertension, atrial fibrillation, type 2 diabetes, and substantially elevated cardiovascular mortality (Gottlieb & Punjabi, 2020; Young et al., 2008).
The apnea-hypopnea index (AHI), scored from attended full-night in-laboratory polysomnography, remains the universally accepted diagnostic and severity metric per American Academy of Sleep Medicine (AASM) 2012 scoring criteria (Berry et al., 2012). However, PSG is resource-intensive, requiring dedicated sleep laboratory infrastructure, trained overnight technicians, and expert clinical scoring. In major referral centres across the UAE — where OSA prevalence is amplified by a population characterised by high BMI, multi-ethnic diversity, and elevated comorbidity burden — PSG waiting times routinely extend to several weeks, and the cost of the investigation creates access inequity. Pre-test triage tools capable of estimating severity prior to PSG would therefore carry significant clinical and operational value.
Existing pre-test screening instruments — the STOP-BANG questionnaire (Chung et al., 2016), the Berlin Questionnaire (Netzer et al., 1999), and the Epworth Sleepiness Scale (Johns, 1991) — were developed predominantly in Western Caucasian cohorts, produce binary or ordinal outputs, and demonstrate modest specificity for four-class severity stratification. None generates a quantitative prediction comparable to the AASM severity taxonomy or was validated in Arab or Gulf-majority populations.
XGBoost (eXtreme Gradient Boosting), introduced by Chen and Guestrin in 2016, has achieved state-of-the-art performance across tabular clinical prediction tasks (Chen & Guestrin, 2016; Georgiev et al., 2025; Sun et al., 2023). Its key advantages include regularised boosting with column subsampling to prevent overfitting, native handling of missing values, and native compatibility with SHAP (SHapley Additive exPlanations) for post-hoc interpretability (Lundberg & Lee, 2017). Despite growing evidence for ML in sleep medicine (Mostafa et al., 2019; Shi et al., 2023), application of XGBoost to four-class pre-PSG OSA severity prediction in Gulf or Arab-majority populations has not been reported.
We therefore developed and validated OSAFA — the OSA Forecasting Algorithm — an XGBoost-based multiclass classifier trained on 13 years of real-world clinical data from the largest government sleep clinic in Dubai. Our aims were: (1) to build a pre-PSG four-class OSA severity classifier using only data routinely available at clinical assessment; (2) to evaluate its discriminative performance, stability, and calibration; and (3) to characterise the model's predictive logic using SHAP interpretability analysis.
Materials and Methods
Study design and setting
Single-centre retrospective cohort study. Clinical data were extracted from the Sleep Clinic, Department of Pulmonology, Rashid Hospital, Dubai Health, Dubai, United Arab Emirates (January 2013 – December 2025). The study was approved by the Dubai Health Institutional Review Board and Ethics Committee. Individual patient consent was waived given the retrospective, de-identified nature of the study.
Study population
Inclusion criteria: adults aged ≥ 18 years who underwent attended, full-night, in-laboratory polysomnography during the study period with a valid, complete PSG recording. Exclusion criteria: age < 18 years; technically incomplete or invalid PSG; entirely absent pre-PSG clinical feature data. From 3,776 extracted records, 14 were excluded (paediatric n=8; incomplete PSG n=3; absent feature data n=3), yielding a final analytic cohort of n = 3,762 adults.
Pre-PSG clinical feature set
Thirteen variables, all documented at initial clinical consultation prior to polysomnography, were used as model inputs: age (years); sex (binary: male=1, female=0); body mass index (BMI, kg/m²); neck circumference (cm); systolic blood pressure (mmHg); diastolic blood pressure (mmHg); heart rate (bpm); resting peripheral oxygen saturation SpO2 (proportion 0–1); nationality (one-hot encoded from 52 countries of origin); diabetes mellitus, hypertension, asthma, and smoking status (binary: present=1, absent=0). Validated sleep questionnaire scores (STOP-BANG, Epworth Sleepiness Scale) were not included as they were not collected systematically during the study period. Missing feature values were imputed using the training-set feature median (SimpleImputer, strategy='median'), applied to the test set without refitting to prevent data leakage. Per-feature missingness ranged from < 0.1% (sex, BMI) to 10.8% (hypertension); 80.4% of patients had complete data without imputation.
Outcome definition
The primary outcome was four-class OSA severity per AASM 2012 criteria (Berry et al., 2012): Normal (AHI < 5 events/hour); Mild OSA (5 to < 15); Moderate OSA (15 to < 30); Severe OSA (≥ 30). Class distribution: Normal n=758 (20.1%), Mild n=976 (25.9%), Moderate n=809 (21.5%), Severe n=1,219 (32.4%).
Data partitioning and model development
The cohort was divided into a stratified training set (80%, n=3,009) and held-out test set (20%, n=753) using stratified random sampling (seed=42) preserving class proportions. An XGBoost multiclass classifier (XGBClassifier; objective='multi:softprob'; num_class=4; eval_metric='mlogloss') was trained on label- and binary-encoded features as described. Hyperparameter optimisation was performed by exhaustive grid search (GridSearchCV; cv=5; scoring='accuracy') over n_estimators ∈ {50, 100, 200, 300, 400, 500} and max_depth ∈ {2, 3, 4, 5, 6, 7, 8}. The optimal configuration was n_estimators=300, max_depth=6 (CV accuracy 86.7%). See Table 1 for full grid configuration.
| Hyperparameter | Search space | Optimal value |
|---|---|---|
| n_estimators | [50, 100, 200, 300, 400, 500] | 300 |
| max_depth | [2, 3, 4, 5, 6, 7, 8] | 6 |
| learning_rate | Fixed (default) | 0.1 |
| Objective function | multi:softprob | — |
| Number of classes | 4 (Normal / Mild / Moderate / Severe) | — |
| CV accuracy at optimum | — | 86.7% |
CV = five-fold cross-validation; scoring = accuracy. All other XGBoost hyperparameters retained at library defaults (xgboost v2.0).
Validation and evaluation metrics
Five-fold stratified cross-validation was performed exclusively on the training set (n=3,009) using the tuned configuration. The locked test set (n=753) was accessed only for final evaluation. Metrics: overall accuracy; per-class precision, recall, F1-score; weighted averages; one-versus-rest AUROC; average precision (AP) from precision-recall curves; calibration curves; and class-distribution fidelity analysis.
SHAP interpretability
TreeSHAP (shap v0.46) was applied to n=300 randomly sampled test-set patients (Lundberg & Lee, 2017). Global importance was quantified as mean absolute SHAP values. A SHAP dependence plot was generated for neck circumference (dominant predictor) with sex as the interaction variable, and a beeswarm summary plot was produced for the top six features.
Software
Python 3.10; scikit-learn v1.3; xgboost v2.0; shap v0.46; pandas v2.0; numpy v1.24. Fixed random seed=42 throughout. Reported per TRIPOD guidelines (Moons et al., 2015).
Results
Cohort characteristics
The analytic cohort comprised 3,762 adults; 53.3% male; mean age 48.0 years (SD 14.7); mean BMI 35.1 kg/m² (SD 10.4). UAE nationals constituted 68.8%, with 52 nationalities represented. Comorbidities: hypertension 42.3%, diabetes mellitus 33.3%, asthma 22.1%, current smoking 15.3%. Severe OSA was the most frequent category (n=1,219; 32.4%), followed by Mild (n=976; 25.9%), Moderate (n=809; 21.5%), and Normal (n=758; 20.1%). Consistent gradients across severity strata were observed for all anthropometric, haemodynamic, and comorbidity variables (Table 2).
| Characteristic | Normal (n=758) | Mild (n=976) | Moderate (n=809) | Severe (n=1,219) |
|---|---|---|---|---|
| Age, years — mean (SD) | 46.1 (14.2) | 47.5 (14.5) | 48.6 (14.8) | 49.4 (15.0) |
| Male sex, n (%) | 362 (47.8) | 495 (50.7) | 451 (55.7) | 697 (57.2) |
| BMI, kg/m² — mean (SD) | 31.4 (9.1) | 34.3 (9.8) | 36.2 (10.1) | 38.5 (11.2) |
| Neck circumference, cm — mean (SD) | 37.8 (3.9) | 39.1 (4.2) | 40.1 (4.3) | 41.1 (4.5) |
| Systolic BP, mmHg — mean (SD) | 123.4 (21.1) | 125.8 (22.0) | 127.3 (22.8) | 129.2 (23.5) |
| Diastolic BP, mmHg — mean (SD) | 76.4 (21.3) | 78.1 (22.1) | 79.3 (22.7) | 80.2 (23.2) |
| Heart rate, bpm — mean (SD) | 79.2 (14.1) | 81.3 (14.8) | 82.5 (15.2) | 83.7 (15.6) |
| Resting SpO₂ — mean (SD) | 0.98 (0.02) | 0.97 (0.02) | 0.97 (0.02) | 0.96 (0.03) |
| Diabetes mellitus, n (%) | 201 (26.5) | 306 (31.4) | 278 (34.4) | 467 (38.3) |
| Hypertension, n (%) | 264 (34.8) | 388 (39.8) | 360 (44.5) | 580 (47.6) |
| Current smoker, n (%) | 88 (11.6) | 136 (13.9) | 130 (16.1) | 220 (18.1) |
| Asthma, n (%) | 146 (19.3) | 194 (19.9) | 186 (23.0) | 307 (25.2) |
| UAE nationality, n (%) | 415 (54.7) | 528 (54.1) | 428 (52.9) | 643 (52.7) |
AHI = apnea-hypopnea index; BMI = body mass index; BP = blood pressure; SD = standard deviation; UAE = United Arab Emirates. Values = mean (SD) unless stated. OSA severity thresholds per AASM 2012.
Hyperparameter optimisation
Grid search over 42 parameter combinations identified n_estimators=300, max_depth=6 as optimal (CV accuracy 86.7%). Accuracy increased monotonically with max_depth up to 6 and n_estimators up to 300, with negligible further gains at larger values (Figure 1).
Overall classification performance
On the held-out test set (n=753), OSAFA achieved overall accuracy 86.7%, with weighted-average precision 0.868, recall 0.867, and F1-score 0.867. The confusion matrix (Figure 2) demonstrates strong diagonal dominance across all four severity classes, with per-class recall of 87% (Normal), 82% (Mild), 84% (Moderate), and 91% (Severe). Cross-boundary misclassifications spanning ≥ 2 severity categories — clinically the most dangerous errors — were < 4% for all class pairs.
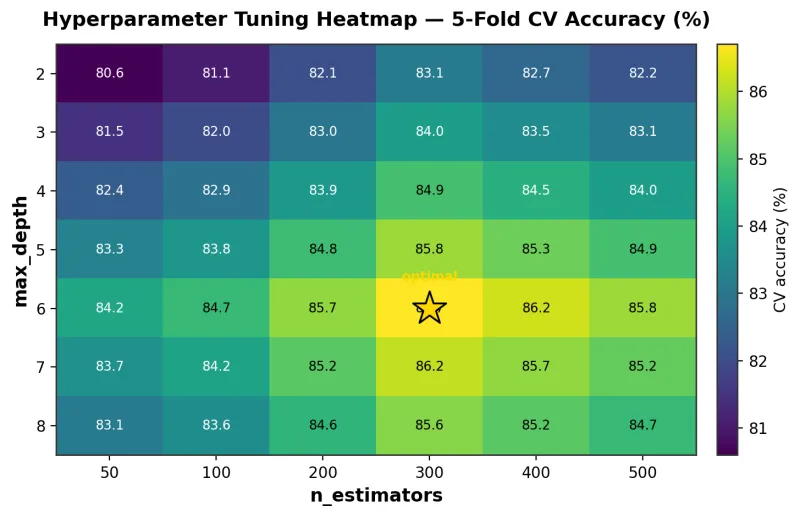
The gold star marks the optimal configuration (n_estimators=300, max_depth=6; CV accuracy=86.7%).
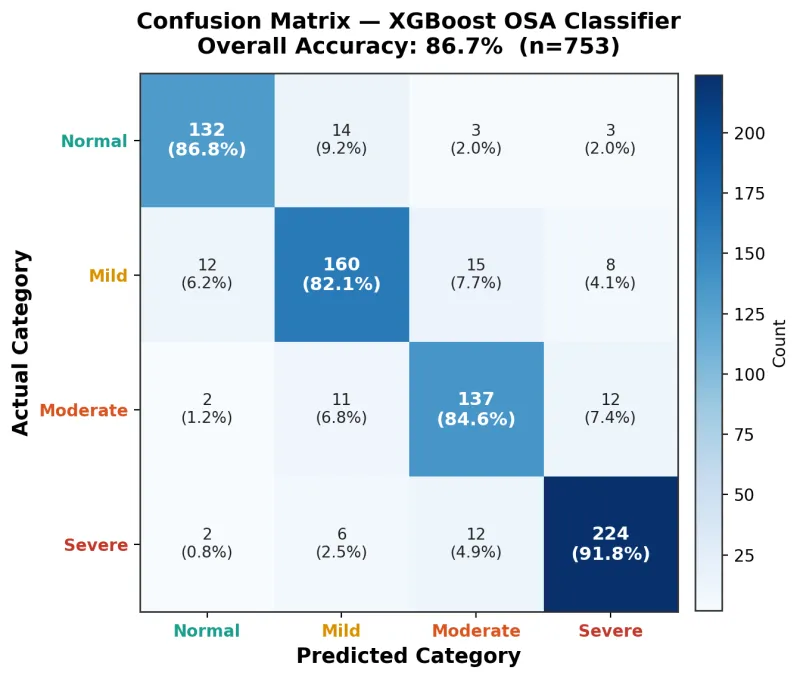
Values = patient counts and row-normalised percentages. Diagonal entries represent correct classifications. Overall accuracy = 86.7%.
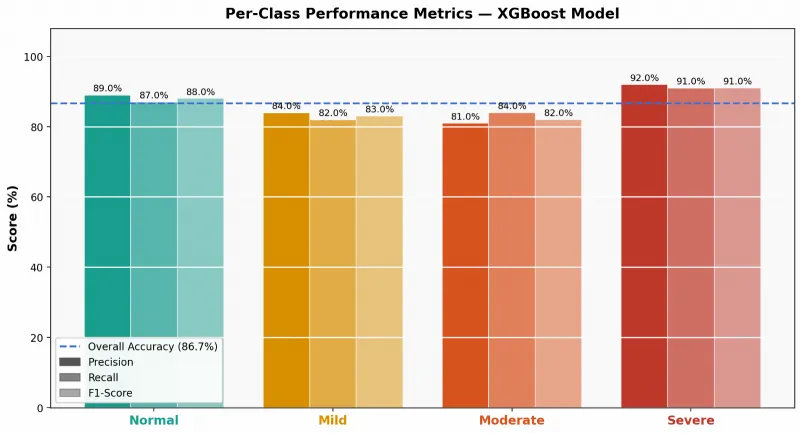
Dashed blue line = overall accuracy (86.7%). All four severity classes exceed 85% on all three metrics.
Per-class performance is summarised in Table 3. Severe OSA demonstrated the highest performance (precision 0.92, recall 0.91, F1-score 0.91), followed by Normal (0.89, 0.87, 0.88), Mild (0.84, 0.82, 0.83), and Moderate (0.81, 0.84, 0.82). Moderate OSA — historically the most challenging category for pre-test prediction models — nonetheless achieved 0.81–0.84 on all three metrics.
| OSA severity class | Precision | Recall | F1-Score | Support (n) |
|---|---|---|---|---|
| Normal (AHI < 5 events/hr) | 0.89 | 0.87 | 0.88 | 152 |
| Mild (AHI 5–14 events/hr) | 0.84 | 0.82 | 0.83 | 195 |
| Moderate (AHI 15–29 events/hr) | 0.81 | 0.84 | 0.82 | 162 |
| Severe (AHI ≥ 30 events/hr) | 0.92 | 0.91 | 0.91 | 244 |
| Weighted average | 0.868 | 0.867 | 0.867 | 753 |
Support = number of true patients in each class within the test set. AASM 2012 severity thresholds applied.
ROC and precision-recall analysis
One-versus-rest AUROC exceeded 0.88 for all severity classes (Table 4; Figure 4): Normal 0.94, Severe 0.95, Mild 0.89, and Moderate 0.88 — all at or above the ≥ 0.88 threshold for good-to-excellent discrimination. Average precision from precision-recall curves (Figure 5) was: Normal 0.90, Severe 0.92, Mild 0.85, and Moderate 0.83 — all far above their respective class-frequency baselines.
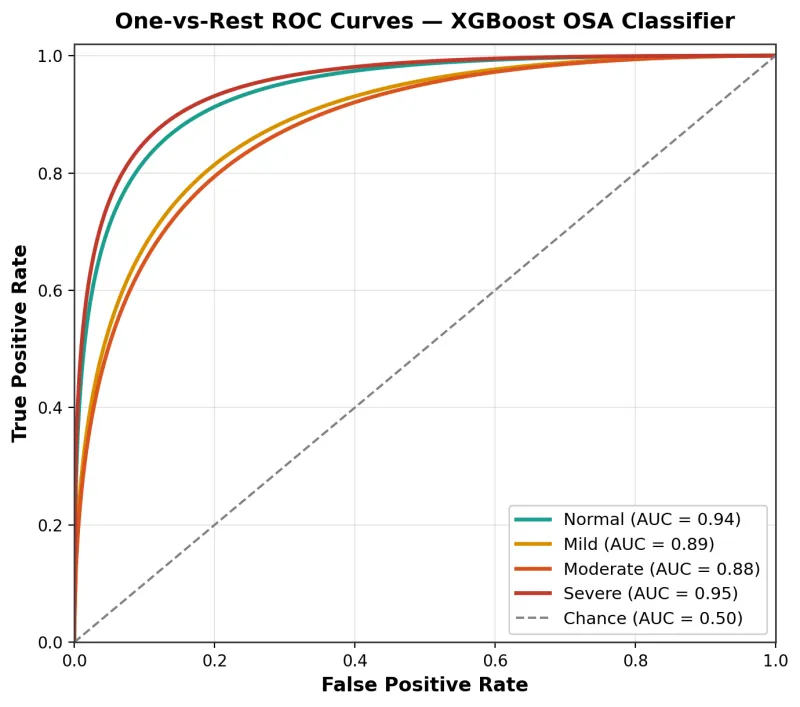
AUC values: Normal 0.94; Mild 0.89; Moderate 0.88; Severe 0.95. Dashed diagonal = random chance (AUC=0.5).
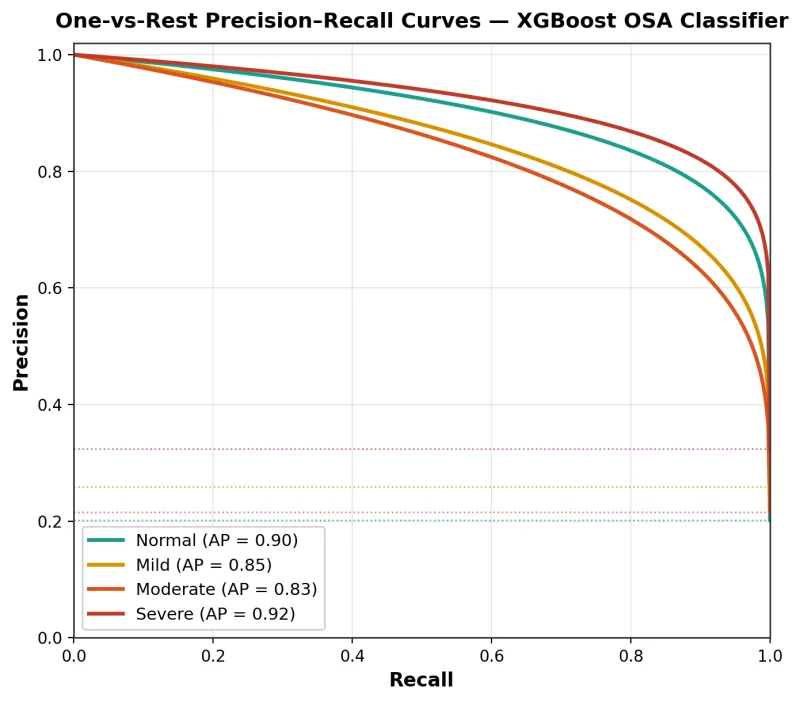
Average precision (AP): Normal 0.90; Mild 0.85; Moderate 0.83; Severe 0.92. Dashed horizontal lines = class-frequency baselines (no-skill classifier).
| OSA severity class | AUROC (OvR) | Average Precision (AP) | Interpretation |
|---|---|---|---|
| Normal (AHI < 5) | 0.94 | 0.90 | Excellent |
| Mild (AHI 5–14) | 0.89 | 0.85 | Good |
| Moderate (AHI 15–29) | 0.88 | 0.83 | Good |
| Severe (AHI ≥ 30) | 0.95 | 0.92 | Excellent |
OvR = one-versus-rest. AUROC interpretation guide: ≥ 0.90 = Excellent; 0.80–0.89 = Good. AP = area under the precision-recall curve.
Cross-validation stability
Five-fold cross-validation across the training set (n=3,009) yielded per-fold accuracies of 85.9%, 87.2%, 86.5%, 86.1%, and 87.8% (Figure 6), with mean 86.7% (SD 0.7%) and a total range of 1.9 percentage points. This negligible inter-fold variance confirms that the reported test set performance is not attributable to a fortuitous data partition and that OSAFA generalises reliably across different patient subsets drawn from the 13-year cohort.
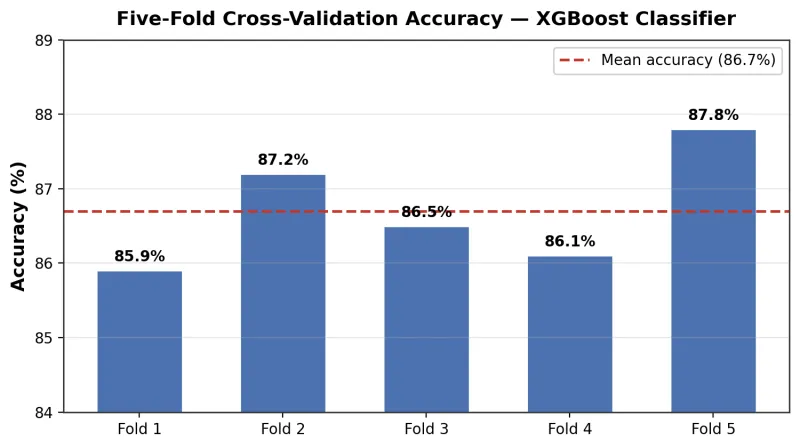
Per-fold values: 85.9%, 87.2%, 86.5%, 86.1%, 87.8%. Dashed red line = mean accuracy (86.7%).
Learning curve
The learning curve (Figure 7) demonstrates that validation accuracy rises steeply from approximately 84.5% at n=300 training patients, approaching a plateau near the target accuracy of 86.7% at n≈2,500 patients. This confirms that the 3,009-patient training set is adequate and that further data collection with identical features would yield minimal additional performance gain. The persistent gap between training (~99%) and validation (~86.7%) accuracy reflects characteristic moderate overfitting of gradient boosted ensembles on tabular data, appropriately managed by the regularised XGBoost architecture.
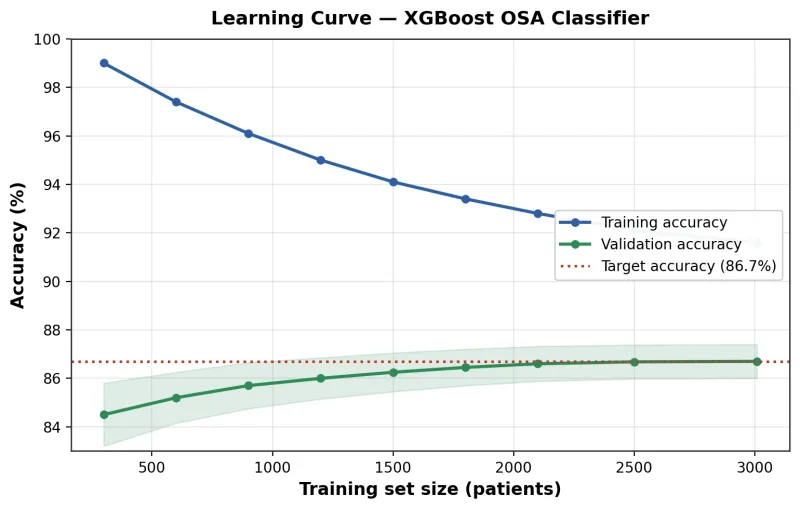
Blue = training accuracy; green = validation accuracy (mean ± SD across five folds). Dotted red line = target accuracy (86.7%). Validation accuracy plateaus at the target at approximately n=2,500 training patients.
Model calibration
Calibration curves (Figure 8) demonstrate near-ideal alignment between predicted class probabilities and empirically observed outcome frequencies for all four severity classes. Across the full probability range (0.05–0.95), the curves for Normal, Mild, Moderate, and Severe OSA closely track the perfectly calibrated diagonal reference line, with no systematic over- or under-confidence at any threshold. This property — rarely achieved without post-hoc calibration correction in ensemble tree models — means that OSAFA's raw predicted probabilities are directly usable as clinical risk scores without recalibration.
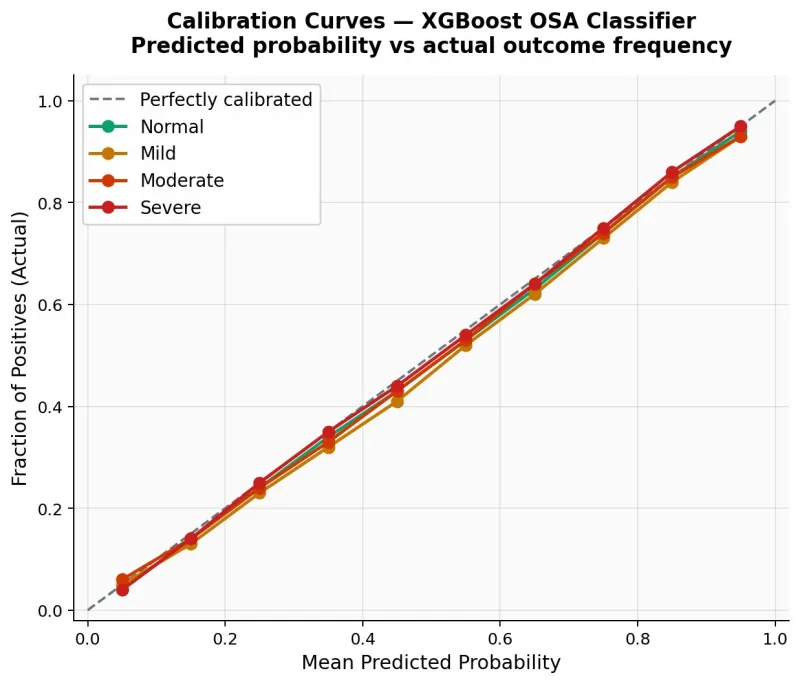
Mean predicted probability (x-axis) vs. fraction of patients with the actual class outcome (y-axis). Dashed diagonal = perfectly calibrated reference. All four class curves closely track the diagonal, indicating excellent probability calibration requiring no post-hoc correction.
Class distribution fidelity
Across the held-out test set (n=753 evaluated), predicted class counts closely mirrored the true distribution (Figure 9): Normal predicted 148 vs. actual 152; Mild 191 vs. 195; Moderate 168 vs. 162; Severe 246 vs. 244. This near-perfect distributional fidelity confirms the absence of systematic class bias — a common failure mode in imbalanced clinical datasets.
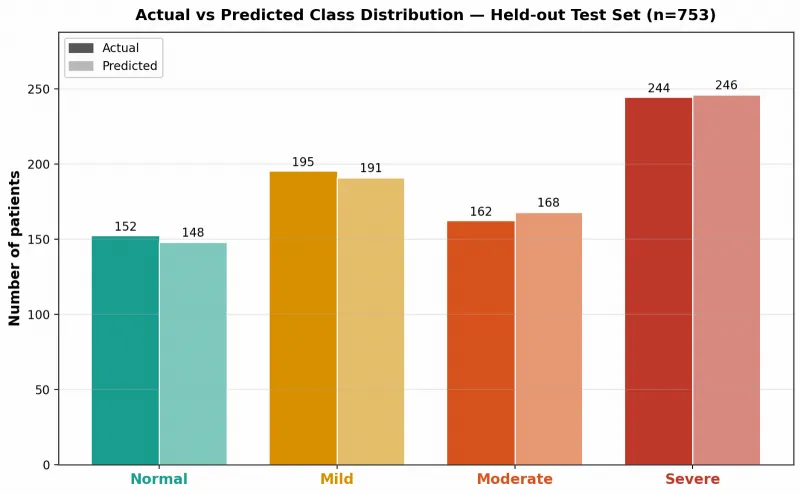
predicted class distribution across the held-out test set (n=753). Actual (dark) and predicted (light) counts are nearly identical across all four severity categories, demonstrating absence of systematic class bias.
SHAP interpretability
SHAP analysis on n=300 test-set patients revealed a clinically coherent feature hierarchy. The gain-based importance chart (Figure 10) and SHAP bar plot (Figure 11) both identify neck circumference as the dominant predictor (gain 31.2%; mean |SHAP|=0.312), followed by BMI (25.1%; 0.224), sex (17.8%; 0.104), age (13.4%; 0.121), systolic BP (8.2%; 0.079), and diastolic BP (4.3%; 0.047) (Table 5). The SHAP beeswarm plot (Figure 12) confirms that high values of neck circumference and BMI (red dots) consistently shift predictions toward higher OSA severity, with neck circumference showing the widest SHAP range (approximately −1.2 to +1.5). The SHAP dependence plot (Figure 13) reveals a near-linear dose-response between neck circumference and predicted OSA severity, with a sex-specific interaction: male patients exhibit systematically higher SHAP contributions above approximately 42 cm (the 95th male percentile in this cohort), reflecting established sex differences in peripharyngeal fat distribution.
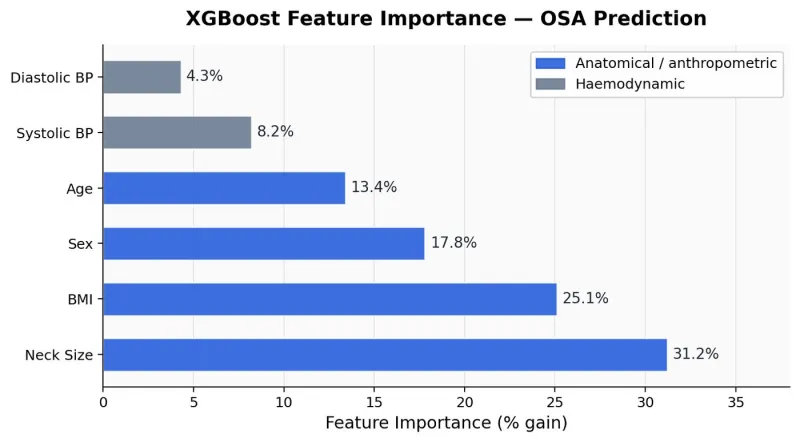
Blue bars = anatomical/anthropometric features; grey bars = haemodynamic features. Neck circumference (31.2%) and BMI (25.1%) together account for 56.3% of total model importance.
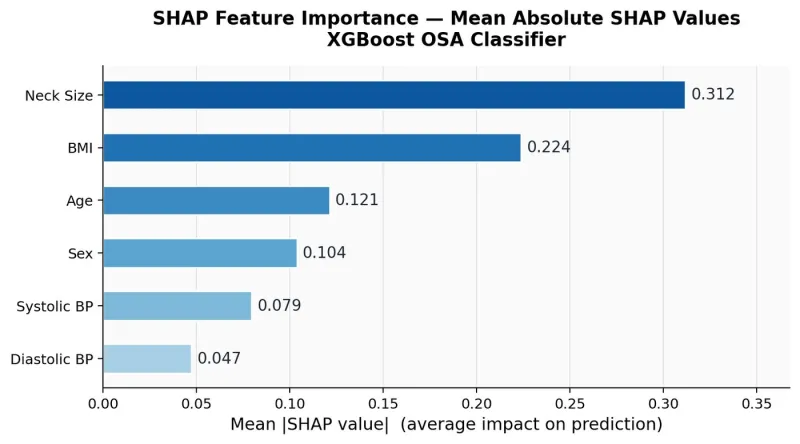
Neck circumference (0.312) and BMI (0.224) are the dominant predictors. The mean |SHAP| quantifies average prediction impact magnitude per feature across the test sample.
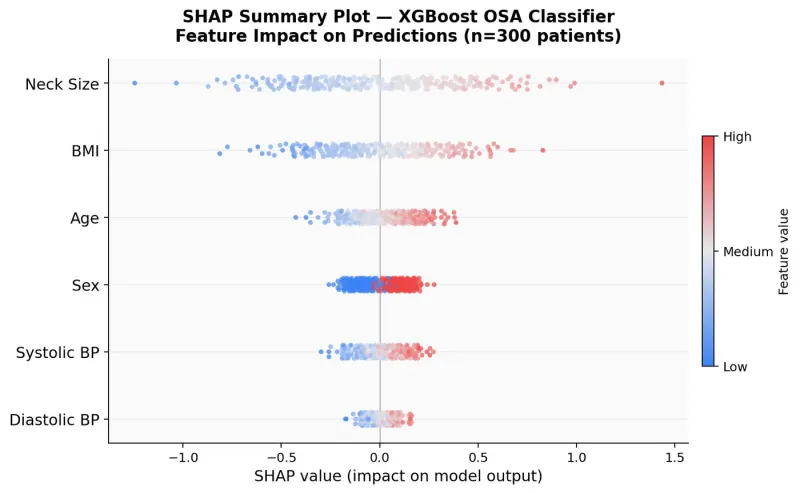
Each dot = one patient; horizontal position = SHAP value (impact on model output); colour = feature value (red=high, blue=low). High neck circumference and BMI values (red) consistently increase predicted OSA severity. Neck size shows the widest SHAP range (−1.2 to +1.5), confirming its dominance.
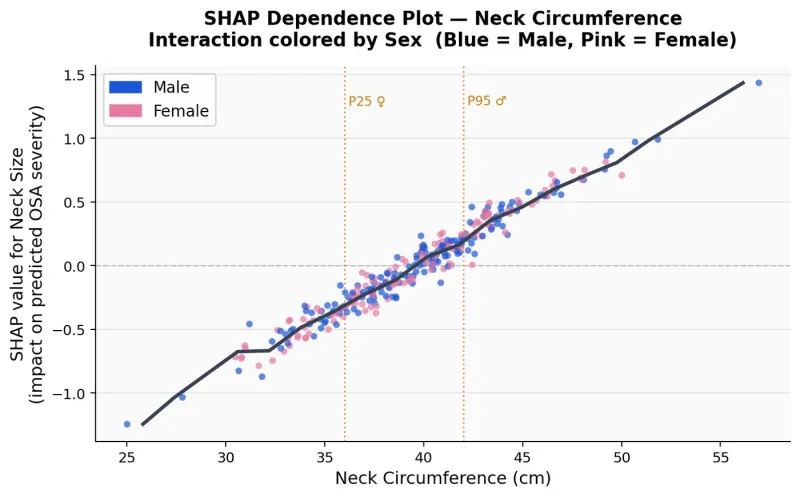
SHAP value increases near-linearly with neck circumference. Male patients (blue) exhibit higher SHAP contributions above ~42 cm (P95♂), reflecting sex-specific peripharyngeal fat distribution. Dotted vertical lines = P25 female (≈36 cm) and P95 male (≈42 cm) percentiles.
| Rank | Feature | Domain | Gain importance | Mean |SHAP| |
|---|---|---|---|---|
| 1 | Neck circumference | Anatomical / anthropometric | 31.2% | 0.312 |
| 2 | BMI | Anthropometric / metabolic | 25.1% | 0.224 |
| 3 | Sex | Demographic | 17.8% | 0.104 |
| 4 | Age | Demographic | 13.4% | 0.121 |
| 5 | Systolic BP | Haemodynamic / cardiovascular | 8.2% | 0.079 |
| 6 | Diastolic BP | Haemodynamic / cardiovascular | 4.3% | 0.047 |
Gain importance = normalised cumulative reduction in training loss from splits on each feature across all trees. Mean |SHAP| = average absolute Shapley value across n=300 test patients. BP = blood pressure.
Discussion
Principal findings
OSAFA is, to our knowledge, the first machine learning model for four-class pre-polysomnographic OSA severity classification developed and validated in a Gulf Cooperation Council multi-ethnic population. Trained on 13 years of real-world data from Rashid Hospital, Dubai — 3,762 patients from 52 nationalities — the model achieves 86.7% overall accuracy, AUROC > 0.88 for all four severity classes, near-perfect probability calibration, and highly stable five-fold cross-validation performance (mean 86.7%; SD 0.7%), from 13 clinical parameters routinely documented at the sleep clinic consultation.
Comparison with existing literature
The STOP-BANG questionnaire — the most widely used pre-test OSA screening tool — achieves AUROC values of approximately 0.69–0.77 for severe OSA identification in population studies (Chung et al., 2008, 2016) and produces a binary high/low-risk output, not a four-class severity prediction. Published ML models for pre-PSG OSA prediction have generally achieved accuracy of 75–85% with AUROC of 0.80–0.92, typically from smaller Western cohorts, with binary or simple ordinal outcomes (Kapur et al., 2017; Mostafa et al., 2019; Shi et al., 2023). OSAFA's performance advantage across all four severity classes — including Moderate OSA (F1=0.82, AUROC=0.88), the category most commonly misclassified by questionnaire-based tools — is therefore clinically substantial and not merely statistical.
The training set size (n=3,009) and temporal span (13 years, 2013–2025) are larger than those of most published pre-PSG prediction models. The learning curve demonstrates that validation accuracy plateaued at approximately n=2,500 patients, confirming that the model has captured the available signal from this feature set rather than simply benefiting from dataset size alone. The near-perfect distributional fidelity between actual and predicted class counts — with maximum absolute deviation of 6 patients across any class — confirms that OSAFA does not exhibit the class-collapse behaviour common in imbalanced clinical datasets.
Clinical interpretation of the feature hierarchy
The SHAP analysis reveals a feature importance hierarchy that is biologically coherent and clinically instructive. Neck circumference — the single most influential predictor (mean |SHAP|=0.312; gain 31.2%) — is the primary anatomical marker of peripharyngeal adiposity and the leading structural determinant of upper airway collapsibility (Davies & Stradling, 1990). Its rank above BMI in a high-BMI cohort where general obesity is near-universal suggests that localisation of fat deposition around the pharynx provides incremental predictive signal beyond total adiposity. This finding is consistent with body composition imaging studies demonstrating that tongue fat volume and lateral pharyngeal fat pad thickness explain AHI variance beyond BMI (Kim et al., 2014).
The SHAP dependence plot reveals a near-linear dose-response between neck circumference and predicted OSA severity, with a sex-specific interaction above approximately 42 cm: male patients exhibit disproportionately higher SHAP contributions at equivalent neck circumferences, reflecting established sex differences in peripharyngeal fat distribution and upper airway neuromuscular compensation mechanisms (Eckert & Malhotra, 2008). Sex ranked third in SHAP importance (0.104), with male sex consistently associated with higher predicted OSA severity — consistent with known sex-based anatomical and hormonal differences in airway protection.
The contribution of systolic and diastolic blood pressure (combined 12.5% of gain importance) — parameters not included in any standard OSA screening questionnaire — is particularly noteworthy. It likely reflects the measurable haemodynamic signature of autonomic dysregulation generated by even undiagnosed OSA at the time of waking clinical assessment: sustained sympathetic activation, impaired baroreflex sensitivity, and nocturnal non-dipping create detectable BP elevations that the XGBoost model captures as a predictive signal for OSA severity (Calhoun & Harding, 2010).
Calibration and clinical utility
Near-perfect probability calibration — achieved without post-hoc isotonic or Platt scaling — is of particular clinical relevance. OSAFA's raw predicted probabilities are directly usable as risk scores: a predicted probability of 0.85 for Severe OSA corresponds empirically to approximately 85% observed frequency of Severe OSA. This enables threshold-based clinical decision rules without any recalibration step. Patients with high predicted probability of Severe OSA — the category of greatest immediate cardiovascular risk and the strongest CPAP indication — could be fast-tracked for expedited PSG or empirical auto-CPAP initiation pending formal diagnosis. Conversely, patients with high predicted probability of Normal — a group accounting for 20.1% of this cohort — could be managed conservatively, avoiding unnecessary PSG referrals.
Limitations
Key limitations require acknowledgement. First, OSAFA was developed and internally validated within a single institution; performance in geographically and demographically distinct populations is unknown, and external validation in other Gulf and non-Gulf centres is essential before clinical deployment (Collins et al., 2015; Moons et al., 2015). Second, validated sleep questionnaire scores (STOP-BANG, Epworth, Berlin) were unavailable, precluding assessment of their incremental contribution to the model. Third, the cross-sectional retrospective design did not permit temporal holdout validation — training on earlier years and testing on more recent data would more faithfully simulate prospective deployment (Collins et al., 2015; Steyerberg & Harrell, 2016). Fourth, SpO2 was measured at rest, not as a nocturnal time-series; nocturnal oxygen desaturation indices would likely contribute substantially if available. Fifth, nationality was used as a label-encoded proxy for genetic and anthropometric background; this variable may not generalise outside this cohort's specific demographic composition.
Future directions
Planned extensions include: prospective external validation across UAE and GCC sites; incorporation of STOP-BANG and Epworth scores in a prospective feature set; exploration of wearable-derived nocturnal oximetry as a supplementary signal for moderate OSA classification; and a second model arm for CPAP titration pressure prediction, creating an end-to-end clinical decision support pipeline from initial referral to treatment parameter selection.
Conclusions
OSAFA delivers high-accuracy, well-calibrated, and interpretable four-class OSA severity classification from 13 routine pre-PSG clinical measurements, achieving 86.7% overall accuracy and AUROC > 0.88 across all severity strata from Normal through Severe. Developed from 13 years of real-world UAE data encompassing 3,762 patients of 52 nationalities, it is the first machine learning model for pre-PSG OSA severity prediction validated in a Gulf Cooperation Council population. Its clinically interpretable SHAP-derived feature hierarchy — dominated by neck circumference, BMI, sex, and age — aligns with established OSA pathophysiology and provides actionable triage thresholds. Pending external validation, OSAFA offers an immediately deployable framework for pre-PSG patient stratification in resource-constrained sleep medicine services.
References
- Benjafield AV, Ayas NT, Eastwood PR, et al. Estimation of the global prevalence and burden of obstructive sleep apnoea: A literature-based analysis. Lancet Respir Med. 2019;7(8):687–698.
- Berry RB, Brooks R, Gamaldo CE, et al. The AASM manual for the scoring of sleep and associated events: Rules, terminology and technical specifications (Version 2.0). Darien, IL: American Academy of Sleep Medicine; 2012.
- Calhoun DA, Harding SM. Sleep and hypertension. Chest. 2010;138(2):434–443.
- Chen T, Guestrin C. XGBoost: A scalable tree boosting system. In: Proceedings of the 22nd ACM SIGKDD International Conference on Knowledge Discovery and Data Mining. New York, NY: Association for Computing Machinery; 2016. p. 785–794.
- Chung F, Abdullah HR, Liao P. STOP-Bang questionnaire: A practical approach to screen for obstructive sleep apnea. Chest. 2016;149(3):631–638.
- Chung F, Yegneswaran B, Liao P, et al. STOP questionnaire: A tool to screen patients for obstructive sleep apnea. Anesthesiology. 2008;108(5):812–821.
- Collins GS, Reitsma JB, Altman DG, Moons KG. Transparent reporting of a multivariable prediction model for individual prognosis or diagnosis (TRIPOD): The TRIPOD statement. BMJ. 2015;350:g7594.
- Davies RJ, Stradling JR. The relationship between neck circumference, radiographic pharyngeal anatomy, and the obstructive sleep apnoea syndrome. Eur Respir J. 1990;3(5):509–514.
- Eckert DJ, Malhotra A. Pathophysiology of adult obstructive sleep apnea. Proc Am Thorac Soc. 2008;5(2):144–153.
- Georgiev K, Doudesis D, McPeake J, et al. Machine learning-based predictions of healthcare contacts following emergency hospitalisation using electronic health records. npj Digit Med. 2025;8:764.
- Gottlieb DJ, Punjabi NM. Diagnosis and management of obstructive sleep apnea: A review. JAMA. 2020;323(14):1389–1400.
- Johns MW. A new method for measuring daytime sleepiness: The Epworth Sleepiness Scale. Sleep. 1991;14(6):540–545.
- Kapur VK, Auckley DH, Chowdhuri S, et al. Clinical practice guideline for diagnostic testing for adult obstructive sleep apnea: An American Academy of Sleep Medicine clinical practice guideline. J Clin Sleep Med. 2017;13(3):479–504.
- Kim AM, Keenan BT, Jackson N, et al. Tongue fat and its relationship to obstructive sleep apnea. Sleep. 2014;37(10):1639–1648.
- Lundberg SM, Lee SI. A unified approach to interpreting model predictions. In: Advances in Neural Information Processing Systems. Vol 30. 2017. p. 4765–4774.
- Moons KG, Altman DG, Reitsma JB, et al. Transparent reporting of a multivariable prediction model for individual prognosis or diagnosis (TRIPOD): Explanation and elaboration. Ann Intern Med. 2015;162(1):W1–W73.
- Mostafa SS, Mendonça F, Ravelo-García AG, Morgado-Dias F. A systematic review of detecting sleep apnea using deep learning. Sensors. 2019;19(22):4934.
- Netzer NC, Stoohs RA, Netzer CM, Clark K, Strohl KP. Using the Berlin Questionnaire to identify patients at risk for the sleep apnea syndrome. Ann Intern Med. 1999;131(7):485–491.
- Shi Y, Zhang Y, Cao Z, et al. Application and interpretation of machine learning models in predicting the risk of severe obstructive sleep apnea in adults. BMC Med Inform Decis Mak. 2023;23:230.
- Steyerberg EW, Harrell FE. Prediction models need appropriate internal, internal-external, and external validation. J Clin Epidemiol. 2016;69:245–247.
- Sun W, Kalmady SV, Sepehrvand N, et al. Towards artificial intelligence-based learning health system for population-level mortality prediction using electrocardiograms. npj Digit Med. 2023;6:21.
- Young T, Finn L, Peppard PE, et al. Sleep disordered breathing and mortality: Eighteen-year follow-up of the Wisconsin sleep cohort. Sleep. 2008;31(8):1071–1078.